Cutting-Edge environmental Modeling

THERE is only one way to "watch" groundwater move. Likewise, the only way to "see" our changing climate, the shaking of an earthquake, or the dispersion of a toxic cloud-other than by living through the event-is by simulating it on powerful computers. By simulating these dynamic events with their many chemical constituents and physical changes, scientists can begin to understand why our environment operates as it does.
Livermore researchers have been modeling the environment for years, often in one and two dimensions. Researchers began modeling the flow of groundwater to solve problems caused by contaminants in the ground. They modeled the atmosphere to learn where a radiation cloud from a nuclear accident would move. With increasing computer power came better codes and more realistic models. Three-dimensional models were an improvement because our world is, after all, three dimensional. But the complex chemical and physical processes were computationally overwhelming. A simulation might take hours or even days to run.
Then came high-performance supercomputing with the Accelerated Strategic Computing Initiative (ASCI), the Department of Energy's program to increase computational power to 100 teraops (trillion floating-point operations per second) by 2005. ASCI computers are developed and acquired to simulate the aging of nuclear weapons and predict their performance. But the arrival of the first ASCI computers in 1996 and the accompanying computing know-how has influenced all Livermore programs, spreading massively parallel computing throughout the Laboratory. Livermore's Multiprogrammatic and Institutional Computing Facility have enabled much of this activity.
The changes wrought by terascale computing are significant. Until recently, it took as long as 18 hours to run a global climate model. With the newest computers, that time is reduced to seconds. Not only are the computers fast, but their many processors, working in parallel, can also handle more variables and solve extremely complex problems. (See S&TR, June 2000, New Day Dawns in Supercomputing.)
Today's simulations are far more realistic. At the Livermore site, groundwater contamination was discovered in 1983, and Livermore was declared a Superfund site in 1987. The contamination consists of widely distributed plumes of several volatile organic compounds, tritium, fuel hydrocarbons, and some dissolved heavy metals. The first simple model, in 1990, showed that to meet current regulatory standards, cleanup would take 80 years. By the mid-1990s, when some of the first three-dimensional models were being developed, we better understood the state of the contamination and were better able to clean it up. Estimated cleanup time was reduced to about 30 years, or to just 10 to 15 years if risk-based remediation was used. Today, with even better models and several innovative remediation technologies at work, the estimated time to complete regulatory cleanup is even less. Researchers now have models of the subsurface whose level of complexity-and hence realism-were unthinkable just a few years ago.
Atmospheric scientist Bill Dannevik of Livermore's Energy and Environment Directorate notes that all environmental simulations have many features in common. "For one thing, they are all 'data-starved,'" he says. "We have only so much information about our atmosphere, our oceans, and especially the ground beneath us. We can't possibly drill enough boreholes to detail every square inch of the geology of our planet. So our models have to be stochastic, which means that they involve a certain amount of probability."
He goes on to say, "To be meaningful, environmental models must incorporate chemistry, physics, and all three dimensions plus time, which makes them very demanding computationally. Incorporating full dimensionality has been perhaps the biggest challenge. Until large, terascale computers came along, we simply could not include everything."
Throughout science, simulation models have been used largely as a diagnostic tool, as an adjunct to theory and experiment. Supercomputers are now the springboard to a new level of simulation that can provide a multidimensional, evolving model of natural events. As the speed of computation continues to increase even faster than predicted by Moore's law, Livermore scientists will be able to perform truly predictive, three-dimensional simulations. Then simulation will emerge as a peer to theory and experiment, revolutionizing the way science and engineering are done.
In the past, observations of natural events have been used to validate environmental simulation models. According to Dannevik, "Today's mostly one-way relationship between observation and model will, in the not too distant future, be transformed into a interactive relationship through which models and sophisticated, mobile sensors are constantly being mutually updated and made 'smarter.'"
Making the Subsurface Visible
Knowing the sources of groundwater contamination might be simple, but knowing where and how quickly the contaminants are traveling in subsurface soil and rock is another matter. Simulation models provide a window into this otherwise unseen, underground world.
Livermore codes are among the first to realistically account for variations in groundwater flow caused by complex geologic differences. Although the mix of varying types of rock and soil has long been known to influence the flow of water and the spreading of contaminants, such natural complexity has typically not been well represented in computer models. A Livermore team led by hydrologist Andy Tompson is using a geostatistical method to handle complex geology in groundwater models.
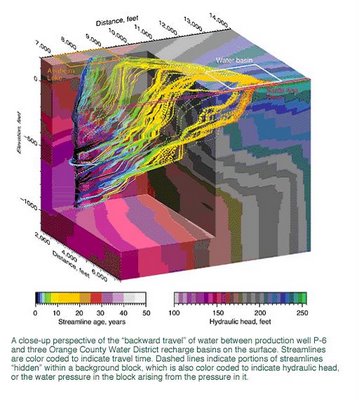
The Orange County Water District in southern California plans to artificially recharge its aquifer with reclaimed water from a treatment plant. Because this water must be underground for at least a year before being used, the district wants to know how long the water is staying underground and where it travels in the subsurface before being withdrawn through a production well (See also S&TR, November 1997,, Isotope Tracers Help Manage Water Resources.)
One three-dimensional image of the area's geology from a highly resolved model is shown in the figure above. The figure on p. 6 shows one simulation of water flowing to a production well. The paths taken by the water from three recharge basins to the well indicate that no water less than a year old comes from the basins. A recent experiment using xenon gas as a tracer was consistent with modeling results. These and other data indicate that small-scale variability in the geologic structure can produce major differences in where water flows. Geologic heterogeneity must be considered in groundwater models.
Work at the Nevada Test Site is another example of the importance of high-resolution computer models. The Underground Test Area (UGTA) project is evaluating the extent of contamination that resulted from 828 underground tests, some of which released radionuclides to the groundwater.
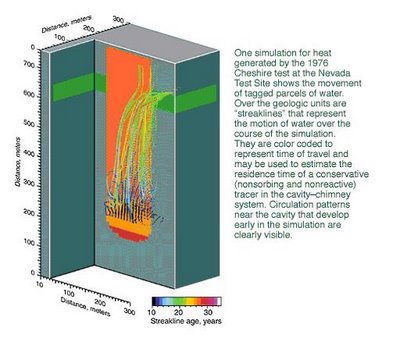
A Livermore team has produced a model that, for the first time, accounts for heat produced by a nuclear test in studies of groundwater flow. An underground nuclear test generates huge amounts of energy, vaporizing everything around it. Rock and soil above the resulting cavity eventually collapse, forming a "chimney" of rubble. Data obtained after the Cheshire test in 1976 showed that significant heat continued to exist in the underground cavity and chimney for as long as 6.5 years after the test. The team used these temperature data to calibrate a nonisothermal model of fluid flow, which suggested that more than 50 years would be needed for conditions to return to normal.
Modeling results indicate that the high temperatures associated with a test persist for several decades and may push water from the cavity area to the upper chimney in 10 to 20 years. This movement contrasts with movement under normal conditions, which takes 100 years or more. The quick upward flow means that the contaminated water has reached a highly permeable geologic zone surrounding the upper reaches of Cheshire's chimney and has a pathway from the test location to a broader area of the test site.
And the Heat Goes on
Another scientific team at Livermore also has concerns about heat underground. It is studying the Yucca Mountain site in Nevada that is the nation's candidate for an underground repository for high-level nuclear waste. According to geochemist Bill Glassley, "One of the biggest challenges of the Yucca Mountain project is determining how the mountain will respond to the tremendous amount of heat generated by the buried waste and if any of those geologic responses will result in the waste packages getting wet." (See S&TR, March 2000, Building a Virtual Time Machine.)
Livermore's supercomputers and newly developed software have allowed a team of Livermore scientists to construct a code to simulate the geologic evolution of the repository for an anticipated lifetime of 100,000 years or more. The code is being used to predict the temperature evolution surrounding buried waste and the possible means by which water will enter the repository's tunnels over the eons.
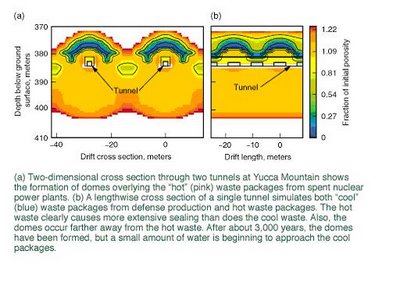
Most of the preliminary simulations have focused on a hypothetical waste emplacement tunnel more than 300 meters below the surface. Different types of waste are separately packaged and generate temperatures ranging from 60 degrees Celsius to as much as 200 degrees Celsius. After about 500 years, significant and irreversible changes to the rock near the waste are apparent. Water that has condensed above the tunnel causes a dome of dissolved minerals to form and partially seal the rock fractures. The hotter waste packages cause more extensive sealing than the cooler packages. Moreover, the partially sealed domes occur farther away from the hot waste than from the cooler waste.
More recent simulations are depicting multiple tunnels, with each tunnel containing waste packages generating different amounts of heat. These simulations are examining how arrays of waste packages will interact over time.
Shake, Rattle, and Roll
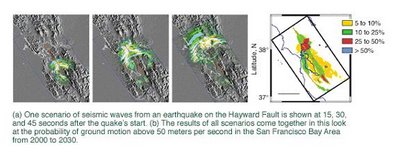
A powerful seismic code developed by Livermore geophysicist Shawn Larsen is helping to tell us what the San Francisco Bay Area's next big earthquake might look like. His E3D code incorporates three-dimensional information about the propagation of seismic waves-how they are radiated from the earthquake's source to the surface and how they interact with the geology and topography in their path.
The next big one may well occur on the Hayward Fault, which runs through the densely populated cities of Oakland and Berkeley, among others. Scientists give this fault a 50 percent probability of producing a magnitude 7 to 7.5 quake in the next 30 years. Seismologists believe that it could cause destruction comparable to that of the 1995 quake in Kobe, Japan, which resulted in 6,000 fatalities and over $100 billion in damage. The figure below shows how E3D and high-performance computing are being used to determine seismic hazards on the Hayward Fault.
E3D is a considerably more powerful seismic code now that it can run on massively parallel computers. For some time, E3D has modeled the effects of compressional (sound) waves as well as shear waves, which move sideways. Shear waves are particularly important for effectively modeling earthquakes. But they are complex and, says Larsen, "computationally overwhelming. We could do three-dimensional models before but only for much smaller problems."
The code is also being used for oil and gas exploration, medical imaging, and structural response studies. For treaty verification, it is being used inversely. Livermore experts are using E3D to determine whether explosions measured elsewhere in the world are the result of seismic activity, a weapon test, or some other cause.
The Virtual Valley
Cutting-edge computers, communication systems, and sensors will combine forces in the Virtual Valley that Lawrence Livermore and the University of California at Davis and Merced plan to create as part of their California Institute for Environmental Informatics and Technologies. A variety of sensors and simulation models will monitor the land, air, and structures of California's Central Valley and Sierra Nevada mountain range to supply information on everything from soil and subsurface properties to atmospheric conditions, land use, hazardous materials distribution and emission inventories, wildfire fuel conditions, ecosystem stresses, power and transportation grid loading, population distribution, seismic activity, and engineered structure inventory.
In the Virtual Valley, historical data, current conditions, and model-generated forecasts will be in a common format. At the same time, a common set of analysis, visualization, and geographic information system tools will be available to explore the myriad interrelationships among the many datasets. The data system will be accessible from multiple viewpoints with various layers designed to suit the needs of everyone from urban planners, to environmental research scientists, to the public at large.
Atmospheric Emergencies
Livermore's Atmospheric Release Advisory Capability (ARAC) was founded in the late 1970s to predict the dispersion of radioactivity into the atmosphere from nuclear accidents or attacks and terrorist incidents. Today, ARAC is one of many emergency response organizations sponsored by the U.S. government to counter dangers and threats to the nation. Over the years, its charter has expanded to include working with all manner of toxic and hazardous atmospheric releases. ARAC scientists can predict the transport and fate of material released during disasters, whether natural or caused by human activity. It makes predictions not only during actual atmospheric releases but also for contingency planning purposes.
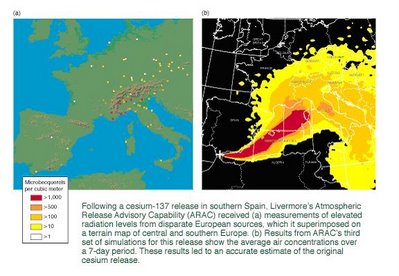
ARAC scientists use several codes to handle the many variables involved in an atmospheric dispersion-for example, wind speed and direction, turbulence, local wind systems such as sea breezes, terrain, and precipitation that might wash toxic material out of the atmosphere. With this knowledge, they have accurately modeled the radiation cloud resulting from the Chernobyl nuclear plant disaster, the eruption of Mount Pinatubo in the Philippines, a release of cesium in southern Spain, and many other toxic and hazardous releases in this country and around the world.
ARAC's response time to these accidents is continually being shortened thanks to better model resolution, with faster computer speed. In addition, ARAC has been able to increase the breadth of its capabilities and the accuracy of its predictions. These improved capabilities are enabling ARAC to meet emerging risks that are not yet formally required in the emergency readiness role defined by sponsors. (See S&TR, June 1999, Forewarnings of Coming Hazards.)
A Global Look at Climate
An offshoot of Livermore's early research and modeling of our atmosphere was an interest in global climate. Thirty years later, Livermore is one the world's premier institutions for the study and simulation of global climate change. Of particular interest are the changes in Earth's climate that may be caused by human activities. The principal source of potential climate change may be the greenhouse gas carbon dioxide (CO2) produced from burning fossil fuels. Humans are introducing 6 billion tons of fossil-fuel-derived CO2 into the atmosphere every year. This and previous emissions have resulted in an increase in the concentration of atmospheric CO2 from about 280 parts per million during the mid 19th century to about 370 parts per million today.
However, not all CO2 generated by human activity stays in the atmosphere. Only about half of the emissions accumulate there, while the rest is taken up by the oceans or vegetation and soils as part of the carbon cycle. The capacity of these "sinks" is expected to change as climate changes. Scientists are estimating the amount of CO2 that will accumulate in the atmosphere by modeling the carbon cycle with its many sources and sinks.
As part of this process, separate models of the various strata of the atmosphere and the oceans have been developed over the years. Now, for the first time, Livermore has the computational strength to bring these models together interactively to answer these questions about CO2 and global climate.
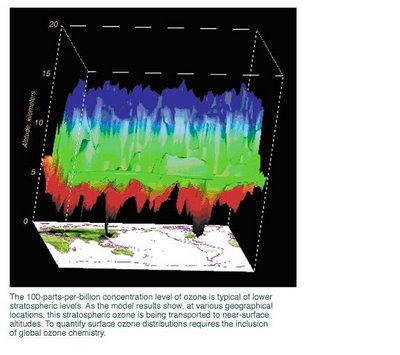
One such first was a coupling of tropospheric (up to 12 kilometers) and stratospheric (12 to 60 kilometers) models to examine the greenhouse gas ozone. Atmospheric chemistry models analyze how natural and human-made emissions of chemical species (for example, via energy production) may alter the distribution of ozone in the stratosphere and troposphere, and more importantly, how these two regions of the atmosphere interact. The figure below shows a 100-parts-per-billion concentration of ozone, which is typical at lower stratospheric levels. As the figure shows, at various geographic locations, stratospheric ozone is being transported to altitudes near Earth's surface. In this example, it is occurring in the northeastern United States and eastern China. These results indicate that global ozone chemistry must be considered in any quantification of surface ozone distributions.
To study the effects of CO2, researchers have combined a detailed atmospheric model with a simplified ocean model. They predicted that the surface temperature would change should the amount of CO2 in the atmosphere double in the future. They found that because of feedback in the climate system, more warming occurs at high latitudes. The most important contributor to this feedback is the sea ice in the Arctic and Antarctic regions, which reflects radiation back to the atmosphere. The CO2 captures more outgoing radiation at low latitudes, so there is less warming.
Livermore's atmospheric models are just now beginning to include aerosols, such as sulfur emissions, and sooty particulate matter, which are also produced when fossil fuels are burned. Scientists now think that aerosols are producing some significant cooling, which may be largely canceling the expected global warming from increased CO2 during the 20th century.
Into the Future
Besides the ever-increasing capability of supercomputers, two other technology trends will make environmental simulations more realistic. These are in the areas of wireless communication systems and sensing devices, both of which are becoming smaller and cheaper. Wireless communication is being seamlessly connected into the Internet and other communication channels. At the same time, environmental sensors are becoming smarter, less invasive, and more mobile so that the information they transmit is more readily usable.
The confluence of these trends will result in an unprecedented ability to measure the environment and to link these measurements instantaneously to advanced simulation models. Together these systems will monitor, characterize, and predict complex environmental processes. Timely collection and insertion of sensor data into live simulations will enable models to "learn" about the details of environmental media and to adapt to and reconfigure themselves for changing conditions. With sensors tied into a global positioning system, the models will also "train" smart, mobile sensors to collect information where and when it is needed, thereby maximizing the quality of incoming information and of the resulting model.
By analyzing real-time environmental data from fixed and mobile sensors, researchers can quickly detect a hazardous material spill or other event, characterize it, supply a quick-response team with needed information, and assess consequences. The Virtual Valley (see the box above), planned for California's Central Valley and Sierra Nevada mountain range, is just one example of the way that networked sensors located in the land, air, water, structures, and transportation systems will be able to work together to feed data to a supercomputing center, where models can be built for a range of users.
The Virtual Valley is one of several endeavors that are part of a great leap forward at Livermore in environmental computing. An Environmental Simulation Center to bring all environmental modeling work under a single organizational umbrella is in the planning stages. Computational experts continue to devise new ways of representing the environment in models. Geostatistical methods and new ways of evaluating risk are just two such examples.
Bill Glassley notes, "There are so many factors to consider when we study fluid moving in Earth's crust. But with the powerful computers we have now, we can incorporate virtually everything and actually watch water move. Then if we change one thing, we can see the results. If we run many simulations adjusting lots of variables, we can begin to learn what really matters, what the important issues are." The same can be said of all modeling-that the purpose is to learn what really matters.
—Katie Walter
Key Words: atmospheric modeling, Atmospheric Release Advisory Capability (ARAC), global climate modeling, groundwater modeling, hydrology, Nevada Test Site, seismic modeling, Underground Test Area, Virtual Valley, Yucca Mountain.
For more information contact Bill Dannevik (925) 422-3132 (dannevik1@llnl.gov).
ABOUT THE SCIENTIST
WILLIAM P. DANNEVIK leads the Laboratory's Atmospheric Sciences Division and is the acting Deputy Associate Director for Energy and Environment. He came to Livermore in 1988 as a member of a weapons code group in the Defense and Nuclear Technologies Directorate. He received his B.S. in engineering science from the University of Texas in 1969 and his Ph.D. from St. Louis University in atmospheric science in 1984. In previous positions, he led an engineering consulting firm from 1974 to 1980 and was on the research staff of the Princeton University program in applied and computational mathematics from 1984 to 1988. He has published numerous articles on computational fluid dynamics, boundary-layer meteorology, high-performance climate simulation, and turbulence theory and modeling.
posted by Jati @ 4:20 PM
![]()

0 Comments:
Post a Comment
<< Home