Simulating Warfare in No Video Game
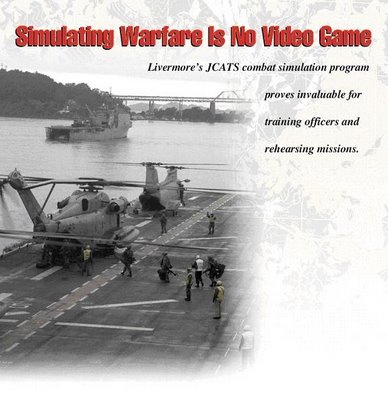
WITH whirling helicopters, grinding tanks, and screaming soldiers, computer war games have become some of the most popular software programs for video arcades and personal computers in recent years. Long before computers became a household item, however, the nation's armed forces were taking advantage of computer-driven combat simulations to train officers, rehearse missions, and explore tactics.
Since the mid-1970s, Lawrence Livermore computer scientists, working at the Conflict Simulation Laboratory, have pioneered increasingly realistic software for the Department of Defense. The Laboratory's landmark Janus program, developed in the late 1970s, was the first conflict simulation to use a graphical user interface. Since then, Livermore experts have remained at the forefront of combat simulation development by taking advantage of steady advances in hardware and software and by working closely with military officers to understand their needs.
By all accounts, the Livermore simulations have proved highly valuable to the military. They have been employed in Operation Just Cause in Panama and Operation Desert Storm in the Mideast, as well as for combat planning in Somalia, Bosnia, and other international trouble spots.
In 1997, a team of computer scientists from the Laboratory's Nonproliferation, Arms Control, and International Security (NAI) Directorate unveiled Livermore's most powerful combat program. JCATS (Joint Conflict and Tactical Simulation) merged and upgraded the capabilities of two earlier programs, the Joint Conflict Model, an advanced version of Janus, and the Joint Tactical Simulation, an urban conflict model. (See S&TR, November 1996, pp. 4-11). Significantly, the program also incorporated important new features requested by its DoD sponsor, the Joint Warfighting Center in Fort Monroe, Virginia, that conferred greater fidelity to the simulations.
JCATS was used to rehearse possible combat options in support of the 1999 Kosovo conflict. It was also used by the Marine Corps and the Navy to plan for and participate in an exercise in the San Francisco Bay Area. During the exercise, JCATS tracked the live participants and tested in real time the effects of virtual air and artillery attacks on the participants.
Taking Physics into Account
Livermore computer scientist Faith Shimamoto, JCATS project leader, notes that every aspect of the program takes physics into account. Typical computer games may look impressive with flashy three-dimensional effects, she says, but they don't always observe the laws of physics.
A typical PC game soldier can jump off a 15-meter cliff without a scratch, but a soldier in JCATS doing the same thing will be badly injured. Neither do commercial games take into account such seemingly mundane but crucial factors as fatigue, inclement weather, low food supplies, or poor visibility. "JCATS realistically simulates the capabilities and limitations of armaments, people, and the environment," she says.
Tom McGrann, deputy leader of the tactical systems section in the Laboratory's Conflict Simulation Laboratory, notes that JCATS is a direct descendant of Janus, building on more than two decades of computer-driven mission analysis and rehearsal experience. "We want to help DoD with software that gives commanders a realistic, cost-effective, and operator-friendly training tool," he says. "Our programs give officers a detailed feel for how combat operations will go, from the deployment of an aircraft carrier to an individual soldier."
The program is currently used for training both individuals and command staffs in tactics and deployment of resources, analyzing the effectiveness of weapons and different force structures, and planning and rehearsing missions. Besides warfighting scenarios, JCATS can also simulate exercises for drug interdiction, disaster relief, peacekeeping, counterterrorism, hostage rescue, and site security. Current users include the Army, Air Force Security Forces, Special Operations Command, Marine Corps, Naval Post Graduate School, U.S. Southern Command, U.S. Army Europe, Department of Energy, and Secret Service.
Program Controls 60,000 Elements
An enhanced version of JCATS released in October 1999 can simulate up to 60,000 individual elements, from soldiers to planes to mob participants. What's more, the new version can run on a workstation as well as on a laptop computer, making it feasible for use in the field.
The new program typically simulates a battle between two opposing sides (often called red and blue forces), but it can accommodate up to 10 sides with friendly, enemy, and neutral relationships. Depending on the rules of engagement established for the conflict, a soldier can be programmed to shoot at the first sign of an opposing force, hide, dig a foxhole, fire only upon positive identification, or take other action. The rules of engagement may change during the simulation as political alliances shift or when civilians become involved.
Players see only their respective forces and whatever intelligence they acquire about opposing forces by visual or auditory means, including forward scouts, spotter planes, radar, and sensors. A large hill, for example, can prevent a soldier from visually spotting enemy forces massing on the other side. Tanks generate noise that can be "heard" by nearby opposing forces.
Typically, a controller at a master workstation has a bird's-eye view and can observe the movement of forces on all sides. To test players' responses to the unexpected, the controller can resurrect fallen troops, change the weather, provide more fuel, speed up the clock, release a biological weapon, and the like.
Games Can Last Weeks
The duration of games varies from 20 minutes for a brief site security exercise involving a few people to two weeks for a complex drug interdiction rehearsal involving different agencies. Sometimes a short game is run dozens of times so that statistical sampling can be used to evaluate a particular tactic or weapon system.
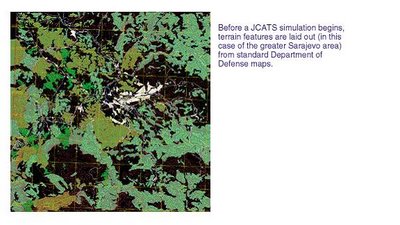
Setting up a JCATS exercise takes one to two weeks depending on the number and kinds of combat forces and, especially, the kinds of topography to be modeled. Terrain is modeled with extraordinary fidelity. Rivers, for example, can be characterized by their current, depth, and underwater obstacles. Players can enter terrain data, including correct elevation and geographical features, from standard DoD maps of the world (such as the one below at the left) and from DoD digitized terrain data.
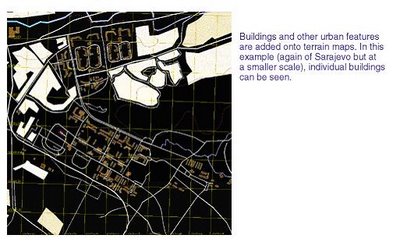
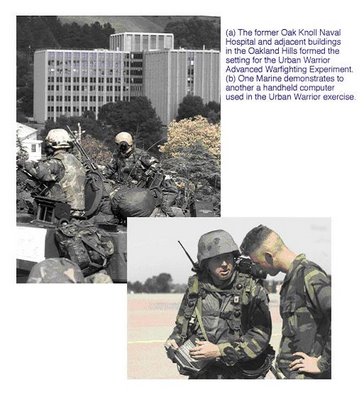
Players can also import blueprints of specific buildings (below) for urban warfare and site security exercises. Or users can create their own town or building, as is often done for drug interdiction training. In these cases, JCATS offers a palette of menus to create everything from windows and doors to streets and parks.
Shimamoto points out that terrain significantly affects movement of troops, aircraft, tanks, and maritime operations. A rescue helicopter cannot safely land in a forest, amphibious landing craft must negotiate rocky shores, vehicles move slowly through swamps, and soldiers slow considerably when marching uphill. Environmental factors such as adverse weather, nightfall, and smoke from combat also affect mobility.
JCATS is unusually flexible in the sheer scale of battle, from the defense of a nation involving thousands of soldiers, planes, ships, and vehicles, to the rescue of a hostage in an underground compound by a handful of special operations personnel. Typically, the maximum simulation area, or playbox, is 660 by 660 kilometers, but it can be expanded under special conditions. Even at this enormous scale, a player can zoom in on a city to view details such as roads, rivers, and buildings, and then select an individual building and examine its floor plans.
Depending on the exercise, players have at their disposal a vast range of weapons, including tracked and wheeled vehicles, aircraft and helicopters, ships and submarines, and even systems that are in the development or conceptual stage. Infantry soldiers may have machine guns, rifles, antitank weapons, mortars, and other munitions. Nonlethal weapons, increasingly important as the military assumes peacekeeping duties around the world, include rubber bullets, clubs, tear gas, pepper spray, stinger grenades, rocks, foam, and fists.
Simulations Strengthen Livermore Site Security
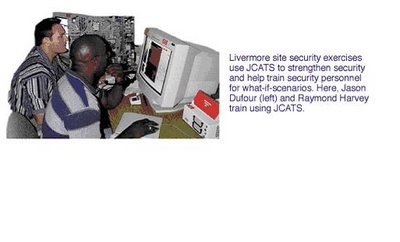
The realism of JCATS simulations in urban settings makes it extremely valuable for assessing and strengthening site security at a range of government facilities, including the very institution that created the program. For the past several months, security managers at Lawrence Livermore have been using JCATS to test established interdiction measures against a variety of adversary scenarios. The work has helped to sharpen security strategies, identify vulnerabilities, and train officers for different kinds of threats, even those deemed highly improbable.
Livermore security managers have conducted more than 200 exercises with JCATS, with each exercise repeated about 10 times. According to Stuart Jossey, security administrator with Livermore's Safeguards and Security Department, most of the scenarios involve attempts to gain entry to the Laboratory's heavily guarded Superblock area that houses special nuclear material. Jossey says that JCATS is invaluable for simulating the close-combat, interior fighting conditions a real incursion might involve.
Currently, a small corps of people including Special Response Team members, Protective Force supervisors, and security administrators participate in JCATS exercises at Livermore. The department's long-range goal is to integrate JCATS into the development of site security tactics and training. Operator proficiency requires between two and three weeks of training. "The scenarios involve a lot of mouse clicks under pressure," Jossey notes.
The exercises are performed at adjoining computer stations by operators controlling a designated number of virtual security personnel driving in patrol cars or patrolling on foot. The operators wear headphones to communicate with each other about what their forces see and hear. Their computer screens display buildings comprising the Superblock area and adjoining facilities as well as the location and health of people under their command.
In a nearby room, another operator controls a number of "bad guys" intent, for example, on breaking into a facility containing special nuclear material. This monitor shows only the intruders and any Lawrence Livermore security members they detect. Jossey, meanwhile, operates a station that depicts the locations of all the participants. He can change the makeup of each opposing force, as well as their weapons, on the fly.
Jossey says the simulations are a powerful supplement to real drills involving players with laser-tag-like weapons that are staged regularly in and around the Superblock area. "It's expensive doing actual exercises," he says. "We also run a safety risk because many of our exercises are done at night with people running on roofs, climbing fences, and responding tactically in patrol cars." JCATS allows the department to test security strategies to help decide what scenarios the actual exercises should focus on.
The completed simulations are saved on disk and then replayed for the participants on a large-screen monitor. Jossey invites comments from participants about the exercise, especially how things might have gone better. He also uses the program's Analyst Workstation feature to obtain statistical data such as casualties and ammunition used.
"We get a lot of good statistical information," he says. "The whole point is to make sure we have designed a strategy that denies unauthorized entry to our critical facilities."
Model's Power Is in the Details
Military operations include clearing barriers; aircraft takeoff and landing; bombing runs; naval gunfire; building foxholes, vehicle holes, and fortifications; sandbagging; looking around, standing, and crouching; recovering weapons and ammunitions; resupplying food, fuel, and ammunition; and mounting onto or dismounting from vehicles, ships, airplanes, and helicopters.
With a feature unique to JCATS, a player may aggregate entities (soldiers, tanks, or other individual units) into a group such as a formation, convoy, squad, or battalion that is then viewed and controlled as one icon. In this way, large formations are more easily viewed and controlled while the program tracks and records activity at the individual entity level. At any moment, a player can zoom in on a squad and examine events involving just a few soldiers, each uniquely outfitted and trained.
The effectiveness of every weapon, from a laser-guided missile to a single bullet, is determined by probability-of-hit and probability-of-kill statistics compiled by DoD. Using these data, JCATS calculates, for example, the blast area and resulting casualties from tripping a land mine. Just as easily, the program calculates if a launched antitank weapon misses the tank, destroys it, incapacitates the tank's movement but leaves its gun free to fire, or destroys the gun but leaves the tank's mobility intact.
Virtual soldiers face hazards from fatigue, enemy and friendly fire, poor health, and inadequate training. Every soldier begins with a certain amount of energy, which is expended more quickly during running or walking uphill. Players can bring in medical assets to attend to the sick or wounded.
In recognition of possible modern enemy capabilities, JCATS can simulate the release of chemical or biological warfare agents as well as other substances that might by employed as poisons during acts of terrorism or warfare. For example, the program can display how exposure to an atmospheric release of a nerve agent can affect personnel. Such capabilities make it useful for developing both military and civilian preparedness and responses.
Many Options to Review a Game
Players can choose from several options to review a completed game. The entire exercise can be replayed at different speeds. The Analyst Workstation, a feature that conducts rapid analyses of exercise data, can also be employed. This capability is especially useful, says Shimamoto, because in combat simulation, only a small fraction of the data is important to any specific factor under scrutiny.
One of JCATS's most significant enhancements is modeling the urban environment for such missions as hostage rescue, disaster relief, mob control, or protecting heads of state along a motor route. In urban settings, players can view groups of buildings as well as individual building floors and their features-including glass and solid walls, windows, doors, and stairwells-roofs, and underground features, such as tunnels, sewers, and garages. Virtual forces fighting inside buildings are hampered by limited lines of sight, poor lighting, and the risk of injury to civilians.
The program's superb urban simulation capabilities led the U.S. Navy and Marine Corps to give JCATS an important role in exercises conducted last March in the San Francisco Bay Area. The Marine Corps exercise was dubbed Urban Warrior Advanced Warfighting Experiment. Its objective was to develop and test new concepts, tactics, and technologies to prepare Marines for combat in the next century, especially activities in urban areas. The Navy's companion exercise, Fleet Battle Experiment-Echo, also took advantage of JCATS. (See S&TR, June 1999, pp. 4-11.)
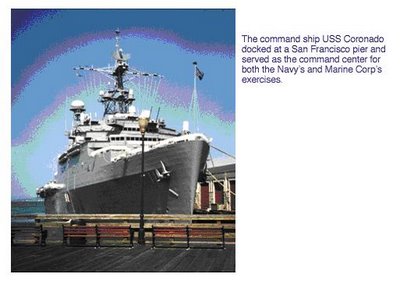
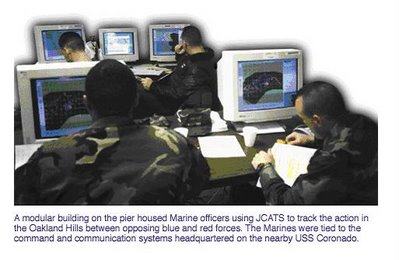
The exercises were run from the Navy command ship USS Coronado, which was docked at a pier in San Francisco. A small building inside the pier housed Marines running JCATS terminals and other command and communications systems. All data were fed to the command ship. Livermore computer scientist Mike Uzelac, director of operations for JCATS, monitored the exercise from the building.
According to McGrann, the Marines focused on an urban exercise because its studies show that by 2020, about 70 percent of the world's population will live in cities and at least 80 percent of those cities will be located within 300 miles of the coastline. Fighting in urban areas, says McGrann, is particularly treacherous because of the danger to the civilian population and because of the numerous hiding places for opponents.
Enemies Eye Urban Warfare
A recent statement by Col. Mark Thiffault, Director, Joint Information Bureau, Urban Warrior, underscores the Marines' commitment to winning urban battles: "Our enemies, having watched Desert Storm on CNN, know they cannot engage the United States with conventional methods. These potential foes view cities as a way to limit the technological advantages of our military. They know that cities, with their narrow streets, confusing layout and large number of civilian noncombatants, place limits on our technological superiority and especially our use of firepower. We have to develop technologies that allow us to win while minimizing collateral damage."
McGrann says that the Marines are concerned about the performance degradation that occurs in standard command, control, communications, computer, and intelligence systems because of cities' concrete buildings, phone lines, and other electronic devices. As a result, Urban Warrior Marines experimented with wireless communications devices, satellite links, remotely piloted reconnaissance aircraft, and global positioning system links.
The focus of the exercise was an intense battle between some 700 battle-dressed Marines, divided into red and blue forces, at the former Oak Knoll Naval Hospital in the Oakland Hills. Both sides wore Multiple Integrated Laser Engagement System gear similar to that used in laser-tag games. Red forces, holed up in the hospital, barricaded stairwells with anything they could find as they tried to fight off blue forces intent on taking over the building.
The fierce battle was set against a backdrop of civil unrest taking place in more than 30 small, adjoining buildings. In this outlying area, additional blue forces kept order among noisy reporters, milling civilians, and rock-throwing agitators, all played by paid actors. (Actual video footage of the exercise can be viewed on the Marine Corps's Urban Warrior Web page at www.defenselink.mil/special/urbanwarrior/.)
Prior to the exercise, Marine Corps personnel, who had previously trained on JCATS, modeled the interiors of the buildings (including the hospital's 9 stories and 500 rooms) by digitizing construction blueprints and entering the data into the program's "terrain editor." The Marines' Integrated Global Positioning System Radio System provided updates every 30 seconds on the position of vehicles and soldiers outside buildings. Because the radio system is ineffective inside buildings, every hospital room was wired with the Inside Building Instrumentation System to keep track of each Marine's location and health status (healthy, wounded, or killed) when they were inside.
The ever-changing data on the Marines' locations were broadcast from the Oakland Hills on secure communication links and fed into JCATS for viewing on screen. In this way, command personnel on the pier and aboard the USS Coronado were provided unprecedented, real-time details about the location of their Oakland forces, including the whereabouts of combatants on every floor of the hospital.

Virtual Strikes Complete Exercise
JCATS also simulated the effects of artillery and tactical air strikes that obviously could not be used in the Oakland area. Computer-generated weapons even included systems that currently exist only in concept. The virtual strikes were executed by a Marine JCATS operator in San Francisco, acting on request by an officer at the battle and approved by an operation commander.
The program calculated the time of flight and the effects based on the impact of the virtual strike and the reported location of the live participants. In this way, commanders learned within seconds the effects of using these weapons. Back in Oakland, both red and blue participants were quickly informed through their laser tag and radio gear if they had been wounded or killed by the virtual strikes.
While the battle for control of the hospital raged, JCATS simulated combat on Treasure Island in San Francisco Bay and on the San Francisco-Oakland Bay Bridge. Red forces driving toward Oakland were attacked by blue virtual aircraft. Simulated Navy ships just off the coast were also included in the overall conflict.
Following the exercise, the program provided a thorough review for the command officers. The review showed who was killed and how and when they became casualties, thereby removing much of the uncertainty that often surrounds the lessons-learned process following an exercise.

Uzelac says that the Marines were pleased with the usefulness of JCATS. In particular, "They recognize that combining simulated firepower with live participants allows the Marines to significantly broaden their training missions," especially when environmental or safety restrictions prevent the actual use of weapons. Uzelac adds that the Marines plan to use the program in their next urban exercise, which will incorporate more buildings than were used in Oakland.
The Livermore team is already working on enhancements to JCATS that have been requested by the Joint Warfighting Center. These enhancements will include an information warfare capability, a terrain-generation capability using computer-aided design building files and satellite imagery, and better integration with military communication systems.
Shimamoto notes that one of JCATS's most important advantages is its applicability to all the military services. Although each military service has its own weapons, its own methods of combat operations, and even its own specialized simulation programs, JCATS is a powerful resource for all of them. Because it models all of the services' forces, as well as those of other security organizations, it also encourages better coordination among agencies, both in planning missions and in training officers. "We've made JCATS as powerful and flexible as we know how to help the nation prepare for conflicts in the new century," she says.
-Arnie Heller
Key Words: combat simulation, Conflict Simulation Laboratory, Fleet Battle Experiment-Echo, Janus, JCATS (Joint Conflict and Tactical Simulation), Joint Conflict Model, Joint Tactical Simulation, Joint Warfighting Center, U.S. Marine Corps, Special Response Team, U.S. Navy, Urban Warrior Advanced Warfighting Experiment.
For further information contact Faith Shimamoto (925) 422-8083 (shimamoto1@llnl.gov).
ABOUT THE SCIENTIST
FAITH SHIMAMOTO joined Lawrence Livermore in 1975 while working on her master's thesis in electronics engineering at the University of California at Davis, where she also earned a B.S. in electronics engineering. She has provided computational capabilities development and management support to numerous departments in the Engineering and Computation directorates, recently managing teams in the development of miniature sensor technology for low-Earth and suborbital satellite experiments.
Currently, she is the project leader of the Joint Conflict and Tactical Simulation (JCATS) Conflict Simulation Laboratory in the Nonproliferation, Arms Control, and International Security Directorate. She is responsible for leading the development of JCATS, a real-time simulation program used by the departments of Energy, Defense, and Transportation for training, analysis, and mission planning, particularly in an urban environment. Her responsibilities have included software development and testing and coordination of deliverables with JCATS's primary proponent, the Joint Warfighting Center. She has also developed JCATS for and demonstrated it to other potential users and sponsors.
Cutting-Edge environmental Modeling

THERE is only one way to "watch" groundwater move. Likewise, the only way to "see" our changing climate, the shaking of an earthquake, or the dispersion of a toxic cloud-other than by living through the event-is by simulating it on powerful computers. By simulating these dynamic events with their many chemical constituents and physical changes, scientists can begin to understand why our environment operates as it does.
Livermore researchers have been modeling the environment for years, often in one and two dimensions. Researchers began modeling the flow of groundwater to solve problems caused by contaminants in the ground. They modeled the atmosphere to learn where a radiation cloud from a nuclear accident would move. With increasing computer power came better codes and more realistic models. Three-dimensional models were an improvement because our world is, after all, three dimensional. But the complex chemical and physical processes were computationally overwhelming. A simulation might take hours or even days to run.
Then came high-performance supercomputing with the Accelerated Strategic Computing Initiative (ASCI), the Department of Energy's program to increase computational power to 100 teraops (trillion floating-point operations per second) by 2005. ASCI computers are developed and acquired to simulate the aging of nuclear weapons and predict their performance. But the arrival of the first ASCI computers in 1996 and the accompanying computing know-how has influenced all Livermore programs, spreading massively parallel computing throughout the Laboratory. Livermore's Multiprogrammatic and Institutional Computing Facility have enabled much of this activity.
The changes wrought by terascale computing are significant. Until recently, it took as long as 18 hours to run a global climate model. With the newest computers, that time is reduced to seconds. Not only are the computers fast, but their many processors, working in parallel, can also handle more variables and solve extremely complex problems. (See S&TR, June 2000, New Day Dawns in Supercomputing.)
Today's simulations are far more realistic. At the Livermore site, groundwater contamination was discovered in 1983, and Livermore was declared a Superfund site in 1987. The contamination consists of widely distributed plumes of several volatile organic compounds, tritium, fuel hydrocarbons, and some dissolved heavy metals. The first simple model, in 1990, showed that to meet current regulatory standards, cleanup would take 80 years. By the mid-1990s, when some of the first three-dimensional models were being developed, we better understood the state of the contamination and were better able to clean it up. Estimated cleanup time was reduced to about 30 years, or to just 10 to 15 years if risk-based remediation was used. Today, with even better models and several innovative remediation technologies at work, the estimated time to complete regulatory cleanup is even less. Researchers now have models of the subsurface whose level of complexity-and hence realism-were unthinkable just a few years ago.
Atmospheric scientist Bill Dannevik of Livermore's Energy and Environment Directorate notes that all environmental simulations have many features in common. "For one thing, they are all 'data-starved,'" he says. "We have only so much information about our atmosphere, our oceans, and especially the ground beneath us. We can't possibly drill enough boreholes to detail every square inch of the geology of our planet. So our models have to be stochastic, which means that they involve a certain amount of probability."
He goes on to say, "To be meaningful, environmental models must incorporate chemistry, physics, and all three dimensions plus time, which makes them very demanding computationally. Incorporating full dimensionality has been perhaps the biggest challenge. Until large, terascale computers came along, we simply could not include everything."
Throughout science, simulation models have been used largely as a diagnostic tool, as an adjunct to theory and experiment. Supercomputers are now the springboard to a new level of simulation that can provide a multidimensional, evolving model of natural events. As the speed of computation continues to increase even faster than predicted by Moore's law, Livermore scientists will be able to perform truly predictive, three-dimensional simulations. Then simulation will emerge as a peer to theory and experiment, revolutionizing the way science and engineering are done.
In the past, observations of natural events have been used to validate environmental simulation models. According to Dannevik, "Today's mostly one-way relationship between observation and model will, in the not too distant future, be transformed into a interactive relationship through which models and sophisticated, mobile sensors are constantly being mutually updated and made 'smarter.'"
Making the Subsurface Visible
Knowing the sources of groundwater contamination might be simple, but knowing where and how quickly the contaminants are traveling in subsurface soil and rock is another matter. Simulation models provide a window into this otherwise unseen, underground world.
Livermore codes are among the first to realistically account for variations in groundwater flow caused by complex geologic differences. Although the mix of varying types of rock and soil has long been known to influence the flow of water and the spreading of contaminants, such natural complexity has typically not been well represented in computer models. A Livermore team led by hydrologist Andy Tompson is using a geostatistical method to handle complex geology in groundwater models.
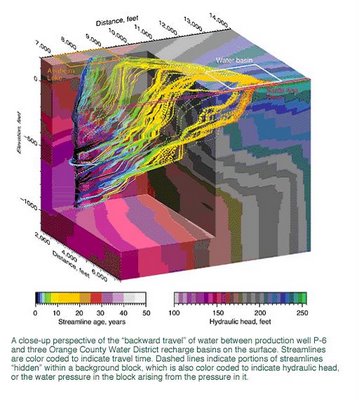
The Orange County Water District in southern California plans to artificially recharge its aquifer with reclaimed water from a treatment plant. Because this water must be underground for at least a year before being used, the district wants to know how long the water is staying underground and where it travels in the subsurface before being withdrawn through a production well (See also S&TR, November 1997,, Isotope Tracers Help Manage Water Resources.)
One three-dimensional image of the area's geology from a highly resolved model is shown in the figure above. The figure on p. 6 shows one simulation of water flowing to a production well. The paths taken by the water from three recharge basins to the well indicate that no water less than a year old comes from the basins. A recent experiment using xenon gas as a tracer was consistent with modeling results. These and other data indicate that small-scale variability in the geologic structure can produce major differences in where water flows. Geologic heterogeneity must be considered in groundwater models.
Work at the Nevada Test Site is another example of the importance of high-resolution computer models. The Underground Test Area (UGTA) project is evaluating the extent of contamination that resulted from 828 underground tests, some of which released radionuclides to the groundwater.
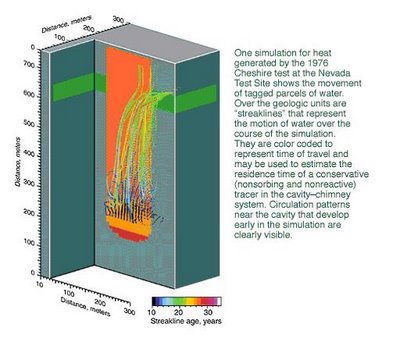
A Livermore team has produced a model that, for the first time, accounts for heat produced by a nuclear test in studies of groundwater flow. An underground nuclear test generates huge amounts of energy, vaporizing everything around it. Rock and soil above the resulting cavity eventually collapse, forming a "chimney" of rubble. Data obtained after the Cheshire test in 1976 showed that significant heat continued to exist in the underground cavity and chimney for as long as 6.5 years after the test. The team used these temperature data to calibrate a nonisothermal model of fluid flow, which suggested that more than 50 years would be needed for conditions to return to normal.
Modeling results indicate that the high temperatures associated with a test persist for several decades and may push water from the cavity area to the upper chimney in 10 to 20 years. This movement contrasts with movement under normal conditions, which takes 100 years or more. The quick upward flow means that the contaminated water has reached a highly permeable geologic zone surrounding the upper reaches of Cheshire's chimney and has a pathway from the test location to a broader area of the test site.
And the Heat Goes on
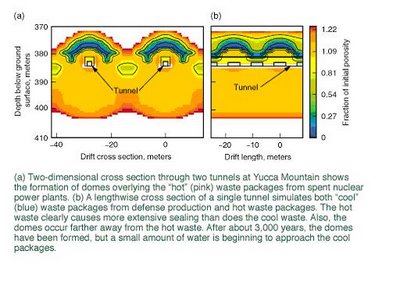
Another scientific team at Livermore also has concerns about heat underground. It is studying the Yucca Mountain site in Nevada that is the nation's candidate for an underground repository for high-level nuclear waste. According to geochemist Bill Glassley, "One of the biggest challenges of the Yucca Mountain project is determining how the mountain will respond to the tremendous amount of heat generated by the buried waste and if any of those geologic responses will result in the waste packages getting wet." (See S&TR, March 2000, Building a Virtual Time Machine.)
Livermore's supercomputers and newly developed software have allowed a team of Livermore scientists to construct a code to simulate the geologic evolution of the repository for an anticipated lifetime of 100,000 years or more. The code is being used to predict the temperature evolution surrounding buried waste and the possible means by which water will enter the repository's tunnels over the eons.
Most of the preliminary simulations have focused on a hypothetical waste emplacement tunnel more than 300 meters below the surface. Different types of waste are separately packaged and generate temperatures ranging from 60 degrees Celsius to as much as 200 degrees Celsius. After about 500 years, significant and irreversible changes to the rock near the waste are apparent. Water that has condensed above the tunnel causes a dome of dissolved minerals to form and partially seal the rock fractures. The hotter waste packages cause more extensive sealing than the cooler packages. Moreover, the partially sealed domes occur farther away from the hot waste than from the cooler waste.
More recent simulations are depicting multiple tunnels, with each tunnel containing waste packages generating different amounts of heat. These simulations are examining how arrays of waste packages will interact over time.
Shake, Rattle, and Roll
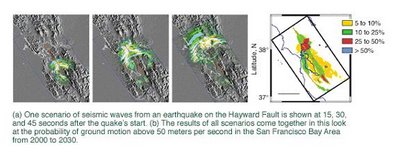
A powerful seismic code developed by Livermore geophysicist Shawn Larsen is helping to tell us what the San Francisco Bay Area's next big earthquake might look like. His E3D code incorporates three-dimensional information about the propagation of seismic waves-how they are radiated from the earthquake's source to the surface and how they interact with the geology and topography in their path.
The next big one may well occur on the Hayward Fault, which runs through the densely populated cities of Oakland and Berkeley, among others. Scientists give this fault a 50 percent probability of producing a magnitude 7 to 7.5 quake in the next 30 years. Seismologists believe that it could cause destruction comparable to that of the 1995 quake in Kobe, Japan, which resulted in 6,000 fatalities and over $100 billion in damage. The figure below shows how E3D and high-performance computing are being used to determine seismic hazards on the Hayward Fault.
E3D is a considerably more powerful seismic code now that it can run on massively parallel computers. For some time, E3D has modeled the effects of compressional (sound) waves as well as shear waves, which move sideways. Shear waves are particularly important for effectively modeling earthquakes. But they are complex and, says Larsen, "computationally overwhelming. We could do three-dimensional models before but only for much smaller problems."
The code is also being used for oil and gas exploration, medical imaging, and structural response studies. For treaty verification, it is being used inversely. Livermore experts are using E3D to determine whether explosions measured elsewhere in the world are the result of seismic activity, a weapon test, or some other cause.
The Virtual Valley
Cutting-edge computers, communication systems, and sensors will combine forces in the Virtual Valley that Lawrence Livermore and the University of California at Davis and Merced plan to create as part of their California Institute for Environmental Informatics and Technologies. A variety of sensors and simulation models will monitor the land, air, and structures of California's Central Valley and Sierra Nevada mountain range to supply information on everything from soil and subsurface properties to atmospheric conditions, land use, hazardous materials distribution and emission inventories, wildfire fuel conditions, ecosystem stresses, power and transportation grid loading, population distribution, seismic activity, and engineered structure inventory.
In the Virtual Valley, historical data, current conditions, and model-generated forecasts will be in a common format. At the same time, a common set of analysis, visualization, and geographic information system tools will be available to explore the myriad interrelationships among the many datasets. The data system will be accessible from multiple viewpoints with various layers designed to suit the needs of everyone from urban planners, to environmental research scientists, to the public at large.
Atmospheric Emergencies
Livermore's Atmospheric Release Advisory Capability (ARAC) was founded in the late 1970s to predict the dispersion of radioactivity into the atmosphere from nuclear accidents or attacks and terrorist incidents. Today, ARAC is one of many emergency response organizations sponsored by the U.S. government to counter dangers and threats to the nation. Over the years, its charter has expanded to include working with all manner of toxic and hazardous atmospheric releases. ARAC scientists can predict the transport and fate of material released during disasters, whether natural or caused by human activity. It makes predictions not only during actual atmospheric releases but also for contingency planning purposes.
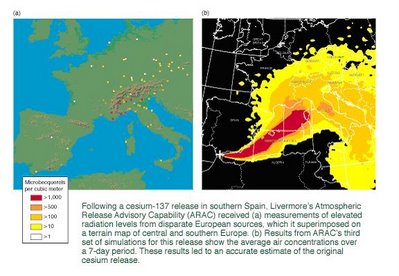
ARAC scientists use several codes to handle the many variables involved in an atmospheric dispersion-for example, wind speed and direction, turbulence, local wind systems such as sea breezes, terrain, and precipitation that might wash toxic material out of the atmosphere. With this knowledge, they have accurately modeled the radiation cloud resulting from the Chernobyl nuclear plant disaster, the eruption of Mount Pinatubo in the Philippines, a release of cesium in southern Spain, and many other toxic and hazardous releases in this country and around the world.
ARAC's response time to these accidents is continually being shortened thanks to better model resolution, with faster computer speed. In addition, ARAC has been able to increase the breadth of its capabilities and the accuracy of its predictions. These improved capabilities are enabling ARAC to meet emerging risks that are not yet formally required in the emergency readiness role defined by sponsors. (See S&TR, June 1999, Forewarnings of Coming Hazards.)
A Global Look at Climate
An offshoot of Livermore's early research and modeling of our atmosphere was an interest in global climate. Thirty years later, Livermore is one the world's premier institutions for the study and simulation of global climate change. Of particular interest are the changes in Earth's climate that may be caused by human activities. The principal source of potential climate change may be the greenhouse gas carbon dioxide (CO2) produced from burning fossil fuels. Humans are introducing 6 billion tons of fossil-fuel-derived CO2 into the atmosphere every year. This and previous emissions have resulted in an increase in the concentration of atmospheric CO2 from about 280 parts per million during the mid 19th century to about 370 parts per million today.
However, not all CO2 generated by human activity stays in the atmosphere. Only about half of the emissions accumulate there, while the rest is taken up by the oceans or vegetation and soils as part of the carbon cycle. The capacity of these "sinks" is expected to change as climate changes. Scientists are estimating the amount of CO2 that will accumulate in the atmosphere by modeling the carbon cycle with its many sources and sinks.
As part of this process, separate models of the various strata of the atmosphere and the oceans have been developed over the years. Now, for the first time, Livermore has the computational strength to bring these models together interactively to answer these questions about CO2 and global climate.
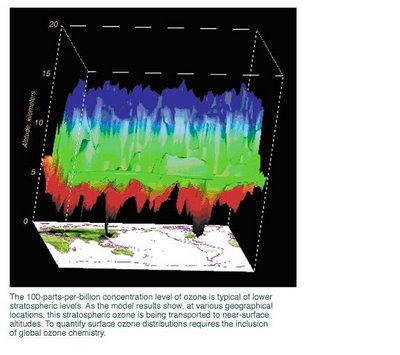
One such first was a coupling of tropospheric (up to 12 kilometers) and stratospheric (12 to 60 kilometers) models to examine the greenhouse gas ozone. Atmospheric chemistry models analyze how natural and human-made emissions of chemical species (for example, via energy production) may alter the distribution of ozone in the stratosphere and troposphere, and more importantly, how these two regions of the atmosphere interact. The figure below shows a 100-parts-per-billion concentration of ozone, which is typical at lower stratospheric levels. As the figure shows, at various geographic locations, stratospheric ozone is being transported to altitudes near Earth's surface. In this example, it is occurring in the northeastern United States and eastern China. These results indicate that global ozone chemistry must be considered in any quantification of surface ozone distributions.
To study the effects of CO2, researchers have combined a detailed atmospheric model with a simplified ocean model. They predicted that the surface temperature would change should the amount of CO2 in the atmosphere double in the future. They found that because of feedback in the climate system, more warming occurs at high latitudes. The most important contributor to this feedback is the sea ice in the Arctic and Antarctic regions, which reflects radiation back to the atmosphere. The CO2 captures more outgoing radiation at low latitudes, so there is less warming.
Livermore's atmospheric models are just now beginning to include aerosols, such as sulfur emissions, and sooty particulate matter, which are also produced when fossil fuels are burned. Scientists now think that aerosols are producing some significant cooling, which may be largely canceling the expected global warming from increased CO2 during the 20th century.
Into the Future
Besides the ever-increasing capability of supercomputers, two other technology trends will make environmental simulations more realistic. These are in the areas of wireless communication systems and sensing devices, both of which are becoming smaller and cheaper. Wireless communication is being seamlessly connected into the Internet and other communication channels. At the same time, environmental sensors are becoming smarter, less invasive, and more mobile so that the information they transmit is more readily usable.
The confluence of these trends will result in an unprecedented ability to measure the environment and to link these measurements instantaneously to advanced simulation models. Together these systems will monitor, characterize, and predict complex environmental processes. Timely collection and insertion of sensor data into live simulations will enable models to "learn" about the details of environmental media and to adapt to and reconfigure themselves for changing conditions. With sensors tied into a global positioning system, the models will also "train" smart, mobile sensors to collect information where and when it is needed, thereby maximizing the quality of incoming information and of the resulting model.
By analyzing real-time environmental data from fixed and mobile sensors, researchers can quickly detect a hazardous material spill or other event, characterize it, supply a quick-response team with needed information, and assess consequences. The Virtual Valley (see the box above), planned for California's Central Valley and Sierra Nevada mountain range, is just one example of the way that networked sensors located in the land, air, water, structures, and transportation systems will be able to work together to feed data to a supercomputing center, where models can be built for a range of users.
The Virtual Valley is one of several endeavors that are part of a great leap forward at Livermore in environmental computing. An Environmental Simulation Center to bring all environmental modeling work under a single organizational umbrella is in the planning stages. Computational experts continue to devise new ways of representing the environment in models. Geostatistical methods and new ways of evaluating risk are just two such examples.
Bill Glassley notes, "There are so many factors to consider when we study fluid moving in Earth's crust. But with the powerful computers we have now, we can incorporate virtually everything and actually watch water move. Then if we change one thing, we can see the results. If we run many simulations adjusting lots of variables, we can begin to learn what really matters, what the important issues are." The same can be said of all modeling-that the purpose is to learn what really matters.
—Katie Walter
Key Words: atmospheric modeling, Atmospheric Release Advisory Capability (ARAC), global climate modeling, groundwater modeling, hydrology, Nevada Test Site, seismic modeling, Underground Test Area, Virtual Valley, Yucca Mountain.
For more information contact Bill Dannevik (925) 422-3132 (dannevik1@llnl.gov).
ABOUT THE SCIENTIST
WILLIAM P. DANNEVIK leads the Laboratory's Atmospheric Sciences Division and is the acting Deputy Associate Director for Energy and Environment. He came to Livermore in 1988 as a member of a weapons code group in the Defense and Nuclear Technologies Directorate. He received his B.S. in engineering science from the University of Texas in 1969 and his Ph.D. from St. Louis University in atmospheric science in 1984. In previous positions, he led an engineering consulting firm from 1974 to 1980 and was on the research staff of the Princeton University program in applied and computational mathematics from 1984 to 1988. He has published numerous articles on computational fluid dynamics, boundary-layer meteorology, high-performance climate simulation, and turbulence theory and modeling.
Process Paragraph
Methane Gas
Methane gas can be extracted from household waste in several steps. First, the waste is put into the warming bed where the waste will be decomposed into dirt methane gas and fertilizer through the process of heating. The fertilizer will be pumped out of the bed, while the dirt methane will flow through the pipe into the dirt trap. Here, the dirt will be concealed through the extraction process. This dirt then can be thrown away via the release cap at the bottom of the trap. Next, the methane is flowed into the gas indicator that contains water.This apparatus has sealed top so that the gas which pops up out of the water won't flow out to the air outside the system and can only flow out of the indicator through the other pipe it has. The gas will pass the pressure releasing tub which contains water to adjust the gas' pressure with the air outside the system. Finally, this pure methane gas is kept in the inner tubes that keep the gas' pressure high so that when the tap is opened, powerful gas will flow out.
Sewage Disposal Unit
In a sewage disposal unit, the sewage is processed in three stages. First, the sewage is put into the Settling Tank through the main sewer. After days in the tank, the undecayed solids which then will be removed and burned will settle. Next, the unsettle sewage is drained to the Pump House for preparation of the next process. The Pump House pumps the polluted water up to the brick work called Sprinkler Beds which consist of rotating arms, jets, and filters for purifying process. The water is dispersed down by the jets under the rotating arms to filter the small solids contained.The filters of stones and micro-organisms then purify the water flowing down through them. This purified water is now clean enough to enter the river.
Good
Process Paragraph
Extracting Methane Gas from Household WasteThere are several process to extract methane gas from household waste.
First, household waste patched into warming bed. In warming bed, part of household waste which can be used as fertilizer
move to the fertilizer pipe, and in the other side,
gas which still contain methane and dirt
move to the next process, to the dirt trap. Dirt trap is a place to divide methane gas from unused dirt. The dirt thrown out through release cap and the methane gas
go to the next step, Gas Indicator. In the Gas Indicator, methane gas passed through the water to purify the methane gas from the water vapor. Then the methane gas
go to the last phase, to be kept in the Gas Holder. The normal pressure methane gas
will keep in a big storage called Inner Tubes that have weight on top of it while the high pressure methane gas will move into the Pressure Release. We can use the methane gas in the storage any time
by turn the gas tap.
Three Stages of Sewage Disposal Unit
There are three stages in the Sewage Disposal Unit. First, in the Settling Tank, sewage water which come from main sewer
divided into polluted water and undecayed solids. The undecayed solids is removed and burned. The polluted water
go to the second stage, the Pump House. In this stage, the polluted water just flows to the third stage through the pipe. The last stage is Sprinkler Beds. Here, jets of polluted water pass to the rotating arms. Then the water is filtered through stones and microorganism to produce the purified water. At the end,
after pass three stages, the purified water flows to the river.
Look at the
red words (grammatically wrong).
Clinical review Recent advances Consumer health informatics
Gunther Eysenbach, researcher.
Unit for Cybermedicine, Department of Clinical Social Medicine, University of Heidelberg, 69115 Heidelberg, Germany
Medical informatics has expanded rapidly over the past couple of years. After decades of development of information systems designed primarily for physicians and other healthcare managers and professionals, there is an increasing interest in reaching consumers and patients directly through computers and telecommunications systems. Consumer health informatics is the branch of medical informatics that analyses consumers' needs for information; studies and implements methods of making information accessible to consumers; and models and integrates consumers' preferences into medical information systems. Consumer informatics stands at the crossroads of other disciplines, such as nursing informatics, public health, health promotion, health education, library science, and communication science, and is perhaps the most challenging and rapidly expanding field in medical informatics; it is paving the way for health care in the information age.
Methods
This non-exhaustive review focuses on topics from the field of consumer health informatics because there has been a markedly increased interest in this field (additional information is available on the BMJ's website). Medline was searched using the terms "consumer" and "informatics." The proceedings of the American Medical Informatics Association's symposiums (1998 and 1999) and the proceedings of the ninth World Congress on Medical Informatics (Medinfo 1998) were hand searched. The AltaVista search engine was used to retrieve information from the internet, using the search string "+definition + consumer health informatics" to find unpublished reports.
Health care in the information age
Medical informatics is "the field that concerns itself with the cognitive, information processing, and communication tasks of medical practice, education, and research." Until recently medical informatics focused on developing applications for health professionals: medical informaticians looked at medical practice mainly through the eyes of health professionals rather than through the eyes of patients. Ten years ago Greenes and Shortliffe wrote: "After many years of development of information systems to support the infrastructure of medicine, greater focus on the needs of physicians and other health care managers and professionals is occurringto support education, decision making, communication, and many other aspects of professional activity." This earlier orientation towards providers can also be found in classic medical informatics textbooks, which rarely contain chapters on the information needs of consumers.
Recent advances
Information technology and consumer health informatics are becoming integral parts of the modern concept of public health and national healthcare policies
Existing systems aimed at professionals are being adapted to be used at home by patients
Electronic health records that are accessible to patients empower consumers and can be used to tailor health information to individuals
Software designed to help users clarify their values and computer based decision aids can help patients to make informed choices and help professionals tailor interventions appropriately
Several initiatives addressing the quality of health information on the internet are being developed, including programmes to educate consumers, encourage self labelling and self regulation of providers, and to evaluate and rate information or enforce compliance with criteria
This focus is changing. Driving factors in this change are the emergence of evidence based medicine and the growing awareness of the need to equalise relationships between health professionals and lay people. These trends can be seen in all developed countries and are partly the result of an effort to cut healthcare costs by improving patients' abilities to help themselves and make informed choices. The increasing availability of interactive information that is accessible to consumers, most notably through the internet and related technologies such as digital television and web television, coincides with the desire of most consumers to assume more responsibility for their health and the pressures of costs on health systems, the emphasis on the health of populations and on prevention, and the growing desire of health professionals to realise the potential of patients and their families. Information technology and consumerism are synergistic forces that promote an "information age healthcare system" in which consumers can, ideally, use information technology to gain access to information and control their own health care, thereby utilising healthcare resources more efficiently. Today's "cyberdocs" on the internet may tomorrow turn into more trustworthy "cyberlicensed" professionals (who are specially trained and whose practice is monitored for quality) counselling patients online; this development is under way in the United Kingdom with the introduction of services such as NHS Direct, which provides advice to patients both on the web and over the phone. Additionally, intelligent informatics applications can channel the floods of health information reaching consumers, can help patients attain a healthy balance between self reliance and seeking professional help, and can also help balance responsiveness to consumers and the management of demand, and virtual and face to face interaction. Information technology and consumer health informatics are becoming an integral part of modern concepts of public health and national healthcare policies in many developed countries.

Bringing medical knowledge to consumers
One challenge is to develop or adapt existing computer based decision support systems (expert systems) for use by consumers. Most of these systems were originally developed to provide advice to clinicians about diagnoses or disease management. A recent multisite, randomised controlled trial studied the effect of two decision support systemsIliad (Applied Medical Informatics, Salt Lake City, UT) and Quick Medical Reference (University of Pittsburgh and Camdat, San Bruno, CA)on the decision making process of medical students, medical residents, and faculty. The study showed that the magnitude of effects was related to clinical experience: inexperienced users (students) benefited more from the advice than users who had more medical experience.18 These results could be extrapolated to lay people (patients) by hypothesising that such systems would provide the greatest benefit to those with the least previous knowledge (provided that the system could be adapted to their specific needs). This is a strong argument for adapting these systems for consumers.
One decision support system that is being adapted and tested for consumers is HouseCall (Applied Medical Informatics), an informatics system derived from the existing physician knowledge base Iliad. HouseCall generates a diagnosis based on the user's symptoms and medical history, allows a personal medical history to be noted, and offers easy to read information on a variety of medical topics. Focus group evaluations of HouseCall have shown that the program is easy to use and that consumers like using technology at home to investigate health issues and like participating in solving their medical problems.
Obviously, such systems "do not and cannot replace visits with physicians; they can, however, make such encounters more productive, for both doctor and patient." They may also help to triage patients. For consumers, the aim of such support systems would not be to make definitive diagnoses or to propose treatment but to answer simple questions such as "do I need to see a doctor?" or to alert patients to potential drug interactions or other health risks.
The main challenge in developing comprehensive systems for consumers is that little is known about how patients interact with computer based informatics tools and how they digest and act on information.
Electronics health records accessible to patients
Consumer health informatics is designed to empower consumers by putting health information into their hands, including information on their own health, such as diagnoses, lab results, personal risk factors, and prescribed drugs. The European Union's data protection directive (in effect since October 1998) requires all member countries to enact legislation enabling patients to have access to their medical records.
Putting records into patients' hands is not a new idea. Baldry et al conducted an early experiment in giving patients in the waiting room their medical records to read, and patient held records seem to have ethical and practical benefits.
One way of facilitating patients' access to their medical records may be through the internet or the adoption of smart cards, or both. The adoption of smart cards was recently announced by the European Union in an initiative which aims to ensure that "all European citizens should have the possibility to have a health smart card to enable secure and confidential access to networked patient information" by 2003. Smart cards can be used as places to store health information directly, or the electronic medical record can be put onto the internet and smart cards can serve as keys by providing access. Just as consumers bank online today, they may in future be able to browse and annotate their health records online.
Tailoring health information to patients
Because an electronic record provides a natural base for individually tailored health messages, online records also open new avenues for health education. On the internet it is possible to link personal information to external resources such as glossaries, websites, and databases such as Medline. For example, if the doctor's list of diagnoses or suggested changes to the patient's lifestyle contains the word "smoking," links can automatically refer the patient to health promotion sites that advise people on how to quit. Future technological advances may bring this kind of information to mobile phones, hand held computers, personal digital assistants, and wearable computers.
In a randomised controlled trial, Jones and colleagues compared the effect of tailored information for cancer patients that was based on the contents of their medical records with general information provided electronically or in leaflets; the patients preferred the tailored information. Tailored information has also been effective in a number of other areas, including instigating changes in health behaviour or in increasing knowledge. In the United States, several projects are under way to evaluate the use of internet based health records that are accessible to patients. For example, a system called SeniorMed gives elderly patients access to their medication lists through the internet. Another company, MedicaLogic (www.medicalogic.com/), is also testing internet based health records (www.98point6.com and www.aboutmyhealth.net). These records are embedded in an information system that lets users search for information on health conditions, order refills for prescriptions, and communicate with their physician's office.
Decision aids to support consumer’s choices
Computer based applications are being developed to help clinicians integrate a patient's preferences (values) with scientific evidence, the patient's history, and local constraints. These systems also help patients make choices for treatment or screening on the basis of their preferences for different outcomes. Such decision aids, which can be used by patients with or without healthcare professionals, are especially desirable when the optimal management strategy depends on the strength of the patient's preferences for the different health outcomes that may result from the decision. For example, a decision system for contraceptives choice would not only take into account personal risk factors (such as smoking) to determine the best choice but also determine the values the patient places on different outcomes, such as unwanted pregnancy or venous thrombosis.
Consumer health informatics
Consumer health informatics applications are designed to interact directly with the consumer, with or without the presence of healthcare professionals, and can broadly be divided into community informatics resources such as health kiosks, community online networks and "cyber-medicine" applications that anyone with a home computer can access8and clinical informatics resources, which are provided to select groups or patients.
Consumer health informatics is not restricted to the use of computers and telecommunications but also includes the delivery of information to patients through other media: the theoretical framework of consumer informatics, for example the analysis of their information needs, is independent of the media through which the information is presented. The computer is not always the most effective medium for delivering information.
It is the field in medical informatics that is concerned with
• Analysing and modelling consumer preferences, information needs, and information use;
• Developing and evaluating methods and applications to support consumers in obtaining and using health information;
• Developing and evaluating methods and applications to integrate consumer needs and preferences into information management systems in clinical practice, education, and research;
• Investigating determinants, conditions, elements, models, and processes to design, implement, and maximise the effectiveness of computerised information and telecommunication and network systems for consumers; and
• Studying the effects of these systems on public health, the patient-professional relationship, and society.
Decision aids differ from information aids mainly in that they contain explicit components to help users clarify their values: the patient's personal values and the utility or importance of the risks and benefits of each alternative are elicited. Because of their interactive nature, computer based solutions have clear advantages over traditional media, and a number of applications already exist. The medical informatics community is increasingly working towards integrating patients' preferences with electronic health records.
Quality control of health information on the internet.
The internet is a vast resource, but to realise its full potential it is necessary to direct consumers to high quality information and to teach them how to assess the quality of information.
The quality control of health information on the internet rests on four pillars: educating the consumer, encouraging the self regulation of providers of health information, having third parties evaluate the information, and enforcing sanctions in cases of dissemination of fraudulent or harmful information.
Considerable progress has been made in all four fields. An ongoing European Union project, the MedPICS Certification and Rating of Trustworthy Health Information on the Net (medCERTAIN; www.medpics.org/medcertain/), is based on the idea that the quality of health information and interactive applications on the internet should not be controlled by a central body or authority but instead must be evaluated and labelled (associated with meta-information) by medical societies, professionals, or consumer organisations. The project is developing a technical infrastructure to allow individuals, organisations, associations, societies, and other entities to rate the published health information found online by using a standardised vocabulary. The medCERTAIN consortium will also create different levels of certification for those who publish health information on the internet; these will range from a simple rating of "good standing" to "gold seals" indicating that the site has been externally peer reviewed.
Several groups have developed interactive internet tools to educate consumers; these tools help users to manually filter information and to assess the quality themselves (www.quick.org.uk, www.discern.org.uk, http://hitiweb.mitretek.org/). However, none of these tools has been validated. Discern, a tool for assessing the quality of written patient information, is being adapted for use on the internet.
A professional code of ethics for stakeholders who have an interest in providing health resources online (such as health portals, academics, and public health experts) has been drafted. In January 2000, about 50 experts in providing health information online attended the "e-health" summit on the ethics of providing information on the internet in Washington, DC; they drew up a code of ethics that addresses issues of quality; commercial behaviour; privacy, security, and confidentiality; and the use of the internet in practising health care.
Conclusion
Although the information society offers tremendous potential for reducing the knowledge gap between professionals and patients, it also brings a risk of a widening of the gap between those who have access to new technology and those who have been excluded. Bridging this digital divide and bringing consumer health informatics to groups that have the greatest need will be particularly challenging. In the industrial age, the inverse care law described the idea that the availability of good medical care tends to vary inversely with the need for medical care in the population served. In the information age, we face an analogous "inverse information law"that is, access to appropriate information is particularly difficult for those who need it most. The vicious circle of low education and low health literacy and low income, poor health, and the inaccessibility of information technology, can only be broken if the field is not left to market forces alone but if public health policy actively brings information technology to those who are underserved.
In 1990, Shortliffe and Perrault wrote that for health professionals "it is increasingly difficult to practice modern medicine without information technologies"a statement that is more true than ever today. However, these days there is an additional trend: it is also increasingly unlikely that health professionals will encounter patients who have not used information technology to influence their health knowledge, health behaviour, perception of symptoms, and illness behaviour. Health professionals should, therefore, not only understand consumer health applications but also ensure that these applications are developed, applied, and evaluated properly.
The greatest contribution of consumer health informatics research to the healthcare sector may eventually be found in its attempts to systematise and codify consumers' needs, values, and preferences; in its research into how information is digested and is best presented to consumers; and in its research into how these variables influence outcome measures. Thus, current health informatics research may have greater implications for the practice of medicine than medical informatics ever did before.
References
1. Hersey JC, Matheson J, Lohr KN. Consumer health informatics and patient decision-making. Rockville, MD: Agency for Health Care Policy and Research, 1997.
2. Patrick K, Koss S. Consumer health information: white paper. http://nii.nist.gov/pubs/chi.html (accessed 12 June 2000).
3. United States General Accounting Office. Consumer health informatics: emerging issues. Washington, DC: US Government Printing Office, 1996.
4. Greenes RA, Shortliffe EH. Medical informatics. An emerging academic discipline and institutional priority. JAMA 1990; 263: 1114-1120
5. Shortliffe EH, Perrault L. Medical informatics: computer applications in health care. Reading, MA: Addison-Wesley, 1990.
6. Van Bemmel JH, Musen MA. Handbook of medical informatics. Heidelberg: Springer, 1997.
7. Coulter A. Paternalism or partnership? Patients have grown upand there's no going back. BMJ 1999; 319: 719-720
8. Eysenbach G, Sa ER, Diepgen TL. Shopping around the internet today and tomorrow: towards the millennium of cybermedicine. BMJ 1999;319 (13 Nov
9. Jadad AR. Promoting partnerships: challenges for the internet age. BMJ 1999; 319: 761-764
10. Smith R. The future of healthcare systems. BMJ 1997; 314: 1495-1496
11. Eysenbach G, Diepgen TL. Evaluation of cyberdocs. Lancet 1998; 352: 1526
12. Pies R. Cybermedicine [letter]. N Engl J Med 1998; 339: 638-639
13. Pencheon D. NHS direct: evaluate, integrate, or bust. BMJ 1998; 317: 1026-1027
14. Pencheon D. Matching demand and supply fairly and efficiently. BMJ 1998; 316: 1665-1667
15. Jadad AR, Gagliardi A. Rating health information on the Internet: navigating to knowledge or to Babel? JAMA 1998; 279: 611-614
16. Wyatt J, Keen J. The NHS's new information strategy. BMJ 1998; 317: 900
17. Ferguson T. Health online and the empowered medical consumer. Jt Comm J Qual Improv 1997; 23: 251-257
18. Friedman CP, Elstein AS, Wolf FM, Murphy GC, Franz TM, Heckerling PS, et al. Enhancement of clinicians' diagnostic reasoning by computer-based consultation: a multisite study of 2 systems. JAMA 1999; 282: 1851-1856
19. Bouhaddou O, Lambert JG, Miller S. Consumer health informatics: knowledge engineering and evaluation studies of medical HouseCall. Proc AMIA Symp 1998:612-6.
Cutting-Edge environmental Modeling
THERE is only one way to "watch" groundwater move. Likewise, the only way to "see" our changing climate, the shaking of an earthquake, or the dispersion of a toxic cloud-other than by living through the event-is by simulating it on powerful computers. By simulating these dynamic events with their many chemical constituents and physical changes, scientists can begin to understand why our environment operates as it does.
Livermore researchers have been modeling the environment for years, often in one and two dimensions. Researchers began modeling the flow of groundwater to solve problems caused by contaminants in the ground. They modeled the atmosphere to learn where a radiation cloud from a nuclear accident would move. With increasing computer power came better codes and more realistic models. Three-dimensional models were an improvement because our world is, after all, three dimensional. But the complex chemical and physical processes were computationally overwhelming. A simulation might take hours or even days to run.
Then came high-performance supercomputing with the Accelerated Strategic Computing Initiative (ASCI), the Department of Energy's program to increase computational power to 100 teraops (trillion floating-point operations per second) by 2005. ASCI computers are developed and acquired to simulate the aging of nuclear weapons and predict their performance. But the arrival of the first ASCI computers in 1996 and the accompanying computing know-how has influenced all Livermore programs, spreading massively parallel computing throughout the Laboratory. Livermore's Multiprogrammatic and Institutional Computing Facility have enabled much of this activity.
The changes wrought by terascale computing are significant. Until recently, it took as long as 18 hours to run a global climate model. With the newest computers, that time is reduced to seconds. Not only are the computers fast, but their many processors, working in parallel, can also handle more variables and solve extremely complex problems. (See S&TR, June 2000, New Day Dawns in Supercomputing.)
Today's simulations are far more realistic. At the Livermore site, groundwater contamination was discovered in 1983, and Livermore was declared a Superfund site in 1987. The contamination consists of widely distributed plumes of several volatile organic compounds, tritium, fuel hydrocarbons, and some dissolved heavy metals. The first simple model, in 1990, showed that to meet current regulatory standards, cleanup would take 80 years. By the mid-1990s, when some of the first three-dimensional models were being developed, we better understood the state of the contamination and were better able to clean it up. Estimated cleanup time was reduced to about 30 years, or to just 10 to 15 years if risk-based remediation was used. Today, with even better models and several innovative remediation technologies at work, the estimated time to complete regulatory cleanup is even less. Researchers now have models of the subsurface whose level of complexity-and hence realism-were unthinkable just a few years ago.
Atmospheric scientist Bill Dannevik of Livermore's Energy and Environment Directorate notes that all environmental simulations have many features in common. "For one thing, they are all 'data-starved,'" he says. "We have only so much information about our atmosphere, our oceans, and especially the ground beneath us. We can't possibly drill enough boreholes to detail every square inch of the geology of our planet. So our models have to be stochastic, which means that they involve a certain amount of probability."
He goes on to say, "To be meaningful, environmental models must incorporate chemistry, physics, and all three dimensions plus time, which makes them very demanding computationally. Incorporating full dimensionality has been perhaps the biggest challenge. Until large, terascale computers came along, we simply could not include everything."
Throughout science, simulation models have been used largely as a diagnostic tool, as an adjunct to theory and experiment. Supercomputers are now the springboard to a new level of simulation that can provide a multidimensional, evolving model of natural events. As the speed of computation continues to increase even faster than predicted by Moore's law, Livermore scientists will be able to perform truly predictive, three-dimensional simulations. Then simulation will emerge as a peer to theory and experiment, revolutionizing the way science and engineering are done.
In the past, observations of natural events have been used to validate environmental simulation models. According to Dannevik, "Today's mostly one-way relationship between observation and model will, in the not too distant future, be transformed into a interactive relationship through which models and sophisticated, mobile sensors are constantly being mutually updated and made 'smarter.'"
Making the Subsurface Visible
Knowing the sources of groundwater contamination might be simple, but knowing where and how quickly the contaminants are traveling in subsurface soil and rock is another matter. Simulation models provide a window into this otherwise unseen, underground world.
Livermore codes are among the first to realistically account for variations in groundwater flow caused by complex geologic differences. Although the mix of varying types of rock and soil has long been known to influence the flow of water and the spreading of contaminants, such natural complexity has typically not been well represented in computer models. A Livermore team led by hydrologist Andy Tompson is using a geostatistical method to handle complex geology in groundwater models.
The Orange County Water District in southern California plans to artificially recharge its aquifer with reclaimed water from a treatment plant. Because this water must be underground for at least a year before being used, the district wants to know how long the water is staying underground and where it travels in the subsurface before being withdrawn through a production well (See also S&TR, November 1997,, Isotope Tracers Help Manage Water Resources.)
One three-dimensional image of the area's geology from a highly resolved model is shown in the figure above. The figure on p. 6 shows one simulation of water flowing to a production well. The paths taken by the water from three recharge basins to the well indicate that no water less than a year old comes from the basins. A recent experiment using xenon gas as a tracer was consistent with modeling results. These and other data indicate that small-scale variability in the geologic structure can produce major differences in where water flows. Geologic heterogeneity must be considered in groundwater models.
Work at the Nevada Test Site is another example of the importance of high-resolution computer models. The Underground Test Area (UGTA) project is evaluating the extent of contamination that resulted from 828 underground tests, some of which released radionuclides to the groundwater.
A Livermore team has produced a model that, for the first time, accounts for heat produced by a nuclear test in studies of groundwater flow. An underground nuclear test generates huge amounts of energy, vaporizing everything around it. Rock and soil above the resulting cavity eventually collapse, forming a "chimney" of rubble. Data obtained after the Cheshire test in 1976 showed that significant heat continued to exist in the underground cavity and chimney for as long as 6.5 years after the test. The team used these temperature data to calibrate a nonisothermal model of fluid flow, which suggested that more than 50 years would be needed for conditions to return to normal.
Modeling results indicate that the high temperatures associated with a test persist for several decades and may push water from the cavity area to the upper chimney in 10 to 20 years. This movement contrasts with movement under normal conditions, which takes 100 years or more. The quick upward flow means that the contaminated water has reached a highly permeable geologic zone surrounding the upper reaches of Cheshire's chimney and has a pathway from the test location to a broader area of the test site.
And the Heat Goes on
Another scientific team at Livermore also has concerns about heat underground. It is studying the Yucca Mountain site in Nevada that is the nation's candidate for an underground repository for high-level nuclear waste. According to geochemist Bill Glassley, "One of the biggest challenges of the Yucca Mountain project is determining how the mountain will respond to the tremendous amount of heat generated by the buried waste and if any of those geologic responses will result in the waste packages getting wet." (See S&TR, March 2000, Building a Virtual Time Machine.)
Livermore's supercomputers and newly developed software have allowed a team of Livermore scientists to construct a code to simulate the geologic evolution of the repository for an anticipated lifetime of 100,000 years or more. The code is being used to predict the temperature evolution surrounding buried waste and the possible means by which water will enter the repository's tunnels over the eons.
Most of the preliminary simulations have focused on a hypothetical waste emplacement tunnel more than 300 meters below the surface. Different types of waste are separately packaged and generate temperatures ranging from 60 degrees Celsius to as much as 200 degrees Celsius. After about 500 years, significant and irreversible changes to the rock near the waste are apparent. Water that has condensed above the tunnel causes a dome of dissolved minerals to form and partially seal the rock fractures. The hotter waste packages cause more extensive sealing than the cooler packages. Moreover, the partially sealed domes occur farther away from the hot waste than from the cooler waste.
More recent simulations are depicting multiple tunnels, with each tunnel containing waste packages generating different amounts of heat. These simulations are examining how arrays of waste packages will interact over time.
Shake, Rattle, and Roll
A powerful seismic code developed by Livermore geophysicist Shawn Larsen is helping to tell us what the San Francisco Bay Area's next big earthquake might look like. His E3D code incorporates three-dimensional information about the propagation of seismic waves-how they are radiated from the earthquake's source to the surface and how they interact with the geology and topography in their path.
The next big one may well occur on the Hayward Fault, which runs through the densely populated cities of Oakland and Berkeley, among others. Scientists give this fault a 50 percent probability of producing a magnitude 7 to 7.5 quake in the next 30 years. Seismologists believe that it could cause destruction comparable to that of the 1995 quake in Kobe, Japan, which resulted in 6,000 fatalities and over $100 billion in damage. The figure below shows how E3D and high-performance computing are being used to determine seismic hazards on the Hayward Fault.
E3D is a considerably more powerful seismic code now that it can run on massively parallel computers. For some time, E3D has modeled the effects of compressional (sound) waves as well as shear waves, which move sideways. Shear waves are particularly important for effectively modeling earthquakes. But they are complex and, says Larsen, "computationally overwhelming. We could do three-dimensional models before but only for much smaller problems."
The code is also being used for oil and gas exploration, medical imaging, and structural response studies. For treaty verification, it is being used inversely. Livermore experts are using E3D to determine whether explosions measured elsewhere in the world are the result of seismic activity, a weapon test, or some other cause.
The Virtual Valley
Cutting-edge computers, communication systems, and sensors will combine forces in the Virtual Valley that Lawrence Livermore and the University of California at Davis and Merced plan to create as part of their California Institute for Environmental Informatics and Technologies. A variety of sensors and simulation models will monitor the land, air, and structures of California's Central Valley and Sierra Nevada mountain range to supply information on everything from soil and subsurface properties to atmospheric conditions, land use, hazardous materials distribution and emission inventories, wildfire fuel conditions, ecosystem stresses, power and transportation grid loading, population distribution, seismic activity, and engineered structure inventory.
In the Virtual Valley, historical data, current conditions, and model-generated forecasts will be in a common format. At the same time, a common set of analysis, visualization, and geographic information system tools will be available to explore the myriad interrelationships among the many datasets. The data system will be accessible from multiple viewpoints with various layers designed to suit the needs of everyone from urban planners, to environmental research scientists, to the public at large.
Atmospheric Emergencies
Livermore's Atmospheric Release Advisory Capability (ARAC) was founded in the late 1970s to predict the dispersion of radioactivity into the atmosphere from nuclear accidents or attacks and terrorist incidents. Today, ARAC is one of many emergency response organizations sponsored by the U.S. government to counter dangers and threats to the nation. Over the years, its charter has expanded to include working with all manner of toxic and hazardous atmospheric releases. ARAC scientists can predict the transport and fate of material released during disasters, whether natural or caused by human activity. It makes predictions not only during actual atmospheric releases but also for contingency planning purposes.
ARAC scientists use several codes to handle the many variables involved in an atmospheric dispersion-for example, wind speed and direction, turbulence, local wind systems such as sea breezes, terrain, and precipitation that might wash toxic material out of the atmosphere. With this knowledge, they have accurately modeled the radiation cloud resulting from the Chernobyl nuclear plant disaster, the eruption of Mount Pinatubo in the Philippines, a release of cesium in southern Spain, and many other toxic and hazardous releases in this country and around the world.
ARAC's response time to these accidents is continually being shortened thanks to better model resolution, with faster computer speed. In addition, ARAC has been able to increase the breadth of its capabilities and the accuracy of its predictions. These improved capabilities are enabling ARAC to meet emerging risks that are not yet formally required in the emergency readiness role defined by sponsors. (See S&TR, June 1999, Forewarnings of Coming Hazards.)
A Global Look at Climate
An offshoot of Livermore's early research and modeling of our atmosphere was an interest in global climate. Thirty years later, Livermore is one the world's premier institutions for the study and simulation of global climate change. Of particular interest are the changes in Earth's climate that may be caused by human activities. The principal source of potential climate change may be the greenhouse gas carbon dioxide (CO2) produced from burning fossil fuels. Humans are introducing 6 billion tons of fossil-fuel-derived CO2 into the atmosphere every year. This and previous emissions have resulted in an increase in the concentration of atmospheric CO2 from about 280 parts per million during the mid 19th century to about 370 parts per million today.
However, not all CO2 generated by human activity stays in the atmosphere. Only about half of the emissions accumulate there, while the rest is taken up by the oceans or vegetation and soils as part of the carbon cycle. The capacity of these "sinks" is expected to change as climate changes. Scientists are estimating the amount of CO2 that will accumulate in the atmosphere by modeling the carbon cycle with its many sources and sinks.
As part of this process, separate models of the various strata of the atmosphere and the oceans have been developed over the years. Now, for the first time, Livermore has the computational strength to bring these models together interactively to answer these questions about CO2 and global climate.
One such first was a coupling of tropospheric (up to 12 kilometers) and stratospheric (12 to 60 kilometers) models to examine the greenhouse gas ozone. Atmospheric chemistry models analyze how natural and human-made emissions of chemical species (for example, via energy production) may alter the distribution of ozone in the stratosphere and troposphere, and more importantly, how these two regions of the atmosphere interact. The figure below shows a 100-parts-per-billion concentration of ozone, which is typical at lower stratospheric levels. As the figure shows, at various geographic locations, stratospheric ozone is being transported to altitudes near Earth's surface. In this example, it is occurring in the northeastern United States and eastern China. These results indicate that global ozone chemistry must be considered in any quantification of surface ozone distributions.
To study the effects of CO2, researchers have combined a detailed atmospheric model with a simplified ocean model. They predicted that the surface temperature would change should the amount of CO2 in the atmosphere double in the future. They found that because of feedback in the climate system, more warming occurs at high latitudes. The most important contributor to this feedback is the sea ice in the Arctic and Antarctic regions, which reflects radiation back to the atmosphere. The CO2 captures more outgoing radiation at low latitudes, so there is less warming.
Livermore's atmospheric models are just now beginning to include aerosols, such as sulfur emissions, and sooty particulate matter, which are also produced when fossil fuels are burned. Scientists now think that aerosols are producing some significant cooling, which may be largely canceling the expected global warming from increased CO2 during the 20th century.
Into the Future
Besides the ever-increasing capability of supercomputers, two other technology trends will make environmental simulations more realistic. These are in the areas of wireless communication systems and sensing devices, both of which are becoming smaller and cheaper. Wireless communication is being seamlessly connected into the Internet and other communication channels. At the same time, environmental sensors are becoming smarter, less invasive, and more mobile so that the information they transmit is more readily usable.
The confluence of these trends will result in an unprecedented ability to measure the environment and to link these measurements instantaneously to advanced simulation models. Together these systems will monitor, characterize, and predict complex environmental processes. Timely collection and insertion of sensor data into live simulations will enable models to "learn" about the details of environmental media and to adapt to and reconfigure themselves for changing conditions. With sensors tied into a global positioning system, the models will also "train" smart, mobile sensors to collect information where and when it is needed, thereby maximizing the quality of incoming information and of the resulting model.
By analyzing real-time environmental data from fixed and mobile sensors, researchers can quickly detect a hazardous material spill or other event, characterize it, supply a quick-response team with needed information, and assess consequences. The Virtual Valley (see the box above), planned for California's Central Valley and Sierra Nevada mountain range, is just one example of the way that networked sensors located in the land, air, water, structures, and transportation systems will be able to work together to feed data to a supercomputing center, where models can be built for a range of users.
The Virtual Valley is one of several endeavors that are part of a great leap forward at Livermore in environmental computing. An Environmental Simulation Center to bring all environmental modeling work under a single organizational umbrella is in the planning stages. Computational experts continue to devise new ways of representing the environment in models. Geostatistical methods and new ways of evaluating risk are just two such examples.
Bill Glassley notes, "There are so many factors to consider when we study fluid moving in Earth's crust. But with the powerful computers we have now, we can incorporate virtually everything and actually watch water move. Then if we change one thing, we can see the results. If we run many simulations adjusting lots of variables, we can begin to learn what really matters, what the important issues are." The same can be said of all modeling-that the purpose is to learn what really matters.
—Katie Walter
Key Words: atmospheric modeling, Atmospheric Release Advisory Capability (ARAC), global climate modeling, groundwater modeling, hydrology, Nevada Test Site, seismic modeling, Underground Test Area, Virtual Valley, Yucca Mountain.
For more information contact Bill Dannevik (925) 422-3132 (dannevik1@llnl.gov).
ABOUT THE SCIENTIST
WILLIAM P. DANNEVIK leads the Laboratory's Atmospheric Sciences Division and is the acting Deputy Associate Director for Energy and Environment. He came to Livermore in 1988 as a member of a weapons code group in the Defense and Nuclear Technologies Directorate. He received his B.S. in engineering science from the University of Texas in 1969 and his Ph.D. from St. Louis University in atmospheric science in 1984. In previous positions, he led an engineering consulting firm from 1974 to 1980 and was on the research staff of the Princeton University program in applied and computational mathematics from 1984 to 1988. He has published numerous articles on computational fluid dynamics, boundary-layer meteorology, high-performance climate simulation, and turbulence theory and modeling.
Virtual Organization
Over the past decade, global competition, changing customer demands, environmental uncertainty, and rapidly evolving technologies have forced organizations to reassess their basic function and structure. The state of technology development has increased exponentially as computers and robots have entered the workplace. One of the effects of these is managers should manage effectively in changing and ill-defined organization structures. The structure of an organization consists of relatively fixed and stable relationships among jobs. The main purpose of organization structure is to influence the behavior of individuals and groups to achieve effective performance.
There are two theories that study management and organization design depending upon the degree of environmental uncertainty. The idea of these designs is an organization structure that enables customers to access its services can be applied at the subunit level as well as the overall organizational level. First is mechanistic design. In this theory, the characteristics of organization structure are highly specialized jobs, homogeneous departments, narrow spans of control, and relatively centralized authority. These characteristic assumptions are found in the historical circumstances within which this theory developed. Examples for such organization are banks, insurance firms, and airlines. Mechanistic designs provide appropriate mechanisms for integrating activities of relatively undifferentiated functions. Another alternative theory is organic design. This theory proposes that a more effective organization has relatively despecialized jobs, heterogeneous departments, wide spans of control, and decentralized authority. These organization structures achieve not only high levels of production and efficiency but also satisfaction, adaptiveness, and development. Examples for such organization are medical care, legal advice, and higher education. These organizations are better to integrate the activities of highly differentiated activities because organic structures provide the flexibility required to deal with the highly uncertain environment that is characteristic of customer demanding quite different services and desiring to play an active part in their delivery. We cannot choose one of these theories as a “best-way” theory. Rather, the manager must adopt the point of view that either the mechanistic or the organic design is more effective for total organization or for subunits within its organization.
One of the fastest developing practices in business throughout involves firms in cooperative relationships with their supplies, distributors, and even competitors. This kind of relationship is called “virtual organization”. Virtual organizations achieve both efficiency and flexibility by establishing networks of relationships with a variety of groups including suppliers, distributors, customers, strategic alliance partners, and even competitors. This relationship enables organization to rely upon smaller, closer to the market partner to sense impending changes in the environment and to respond at the local level.
There are three generic types of accounts available on virtual organizations in the literature. The first one is on organizations that out-source some of their business activities, forming virtual alliances to achieve organizational objectives. Such virtual organizations may be formed by integrating several companies’ core competencies and resources. A virtual company, then, is a collection of several companies organized to behave as if it were a larger, multifaceted organization. Chesbrough and Teece analyzed the practice of businesses in the market place and discussed the problems and concerns with firms going virtual. According to Harrington’s book entitled ‘Organizational Structure and Information Technology’, the second description of virtual organization is related to perceptual organization that is “abstract, unseeing, and existing within the minds of those who form a particular organization”. The third type description is organizations that are built up by virtual links with information technology.
The uncertainty situation nowadays, due to changes in business environment, forces the organization to be more flexible and adaptable. Currently, independent organization are often no longer in a state of being able to provide the desired products or qualities. This need for flexibility can only be guaranteed by several interdependent organizations which react promptly to the customer’s demands. Cooperation between those independent organizations shall be maintained in the form of a network type of virtual organization. This collaboration can be held through the collaboration of core competencies and working methods that the participating parties have. In another word, the participants in a virtual organization complement each others’ competencies and resources in order to complete the customer’s demand. An example of a successful virtual organization is the famous internet store known as “Earth Biggest Bookstore”, Amazon (www.amazon.com). This book firm offers an enormous selection of books that can be searched through several kinds of queries: title, author, description, and ordered via internet with supports from many credit card vendors such as VISA, MasterCard, etc. Actually, this firm is virtual and owns no single book itself. It manages a direct connection with several large publishers to supply customer’s order on desired book. This means that the firm manages no stock, no store, minimal personnel, and minimized logistics.
There are several advantages that virtual organization can offer. The greatest one lies in the fact that it eliminates the physical boundaries of organizations, and that cross-functional teams and organizations are able to operate and collaborate across space and time by communicating with each other via electronic channels. The Internet becomes the most important interface between participating organizations, teams and individuals. Virtual organization also allows businesses to sell and deliver products and services across the world in the most efficient way. For example, www.gramedia.com, an online bookstore from Indonesia, helps people from different city in Indonesia to buy a book from them without going to the store directly and they will send the books directly to the customer’s house. Virtual organization may perceive greater business opportunities since it has an expanded geographical coverage that enables them to get a broader market. This phenomenon lies in the fact that customers of Gramedia bookstore don’t only come from big cities anymore but also from small cities, since www.gramedia.com provides services for customers from small cities. Better market understanding is another benefit of virtual organization, since the customer will get the product exactly as he wants it and almost immediately. Customer will have the joy to acquire almost perfect quality and good service. This will give a virtual organization the edge over its competitors. In virtual organizations, team members do not necessarily need to be in the same location and might not meet physically. A good example is engineering companies who have different sites around the world to do work 24 hours a day. They are taking advantage of the time zones. For example, when the shift in Europe finishes, the work is passed to the team members in the United States. It will reduce cost and time. Another advantage of virtual organization is better management information and better integration of suppliers and vendors. When the virtual organization can reduce its product cost, it will have more chances on the market thus the supplier will be able to sell more products to his client. Therefore, the supplier will be happy to continue working with the company. Vendors are something valuable. They promote and explain the products. This helps to grow with the customer and fulfilling his demands even better. Feedback is a very important thing to increase quality and customer satisfaction. With virtual organization, the vendor and the supplier are integrated together. The information transformation and flow between them are collected and arranged well in virtual organization. Therefore, the company will work more efficiently.
Although virtual organization has many advantages such as reducing the cost, being able not to pay the infrastructure, or becoming an umbrella organization, the virtual organization has some weaknesses, not from the concepts but they come from the theories itself. Virtual organization is lack of appropriate theories. It usually runs itself without the needs of formal theories. Another weakness is inconsistent paradigm, and lack of formal modeling tools [L. M. Camarinha-Matos, 2004]. Other considered disadvantage is hard to determine how the relationships between components in virtual organization should be organized. Organizing the customers, suppliers, employers, etc need great efforts and a lot of evaluations. This process can consume more time. Virtual organization itself should be aware of dynamic changes of global economy, this also need proper system to design.
Those disadvantages above can be reduced within time and experiences. The theories of virtual organization develop within time. P. Sieber and J. Griese mention in their paper abstract2 that virtual organization is a goal-oriented enterprise (i.e. unit or function within a company) operating under metamanagement. Metamanagement characterizes the management of a virtually organized task. A virtually organized task is a goal oriented activity that is implemented by an appropriate assignment or reassignment of concrete satisfiers to the abstract requirements of a task. (switching is the process of assignment and reassignment.). That statement supports that virtual organization focus on the goal not the process. The other theories we should start a virtual community than build the virtual organization to reach the virtual enterprise. In order to understand a virtual organization some expert use the theories in other discipline such as multi agent system, complexity theories, self-organizing systems, graph theory, network analysis, game theory, formal engineering methods, etc.
In order to create a well-organized and well-managed virtual organization we need to model it first. Creating a realistic model of virtual organization is a very hard work. Modeling is a very suitable means to aid designing, communicating, and implementing virtual organizations3. There are some model approaches such as management model (framework model, concepts model), management oriented process model, system requirement model, and enacted model. Management models depict the core concepts and elements of the (virtual) organization. They usually set the frame of reference or high-level architecture of the VO, and thus support understanding and discussing the main principles. Nowadays, some tools are supporting the modeling process in virtual organization although they cannot always satisfy the developers. Those are the VSD (Value System Designer), CIMOSA (CIM Open System Architecture), GERAM, etc. Creating model in virtual organization need some steps, that are: developing business architecture for VO or adopting it from reference models, detailing processes and roles to a level sufficient for employees or researchers to understand (and operate in) new organization, and detailing processes, data requirements and views for system development or system enactment2. By creating a good model we can create a well organized virtual organization. This model will also help us on following the world changes well.
To sum up, virtual organization as one of the fastest developing practices in business offers us flexibility and adaptability. This virtual organization, which isn’t able to be seen, forms virtual alliances to achieve organizational objectives, exists within the minds of those who form the organization, and it is built up by virtual links with information technology. Virtual organization offers us a lot of benefits such as eliminating physical boundaries of organizations through electronic channels, efficient in delivering products and services, expanding business coverage, better market understanding, 24-hour business a day, and reducing products cost. It has also some disadvantages, such as lack of appropriate theories and formal modeling tools, inconsistent paradigm, and hard to organize the components’ relationships in a virtual organization. Despite of its disadvantages, virtual organization is still considered a great prospect in business, especially in the future. By creating a good realistic model of virtual organization, a well organized virtual organization can be developed and the disadvantages can be reduced within time and experiences.
References
(1) Harrington, J. (1991) Organizational Structure and Information Technology, New York : Prentice Hall.
(2) Sieber, P. and Griese, J.. 1999. Organizational Virtualness and Electronic Commerce Proceedings of the 2nd International VoNet – Workshop Zurich, September 23-24, 1999 Simowa Verlag Bern.http;//virtual-organization.net
(3) Loeh, Hermann, Chunyan Zhang, and Bernhard Katzy. Modeling for Virtual Organizations http://www.cetim.org/wps
Anggota Kelompok:
1. Dian Syahfitra (13504021)
2. Gahayu Handari E. (13504031)
3. Morenvino (13504034)
4. Ray Aditya Iswara (13504045)
5. Anton Rifco Susilo (13504046)
6. Dani (13504060)
7. Stevens Jethefer (13504080)
8. Anthony Hertanto (13504102)
9. Nicolas Andres (13504109)
10. Christopher Kurniawan (13504117)